
Zabbix
Zabbix 8.0 LTS: when monitoring learns to see, correlate, and talk
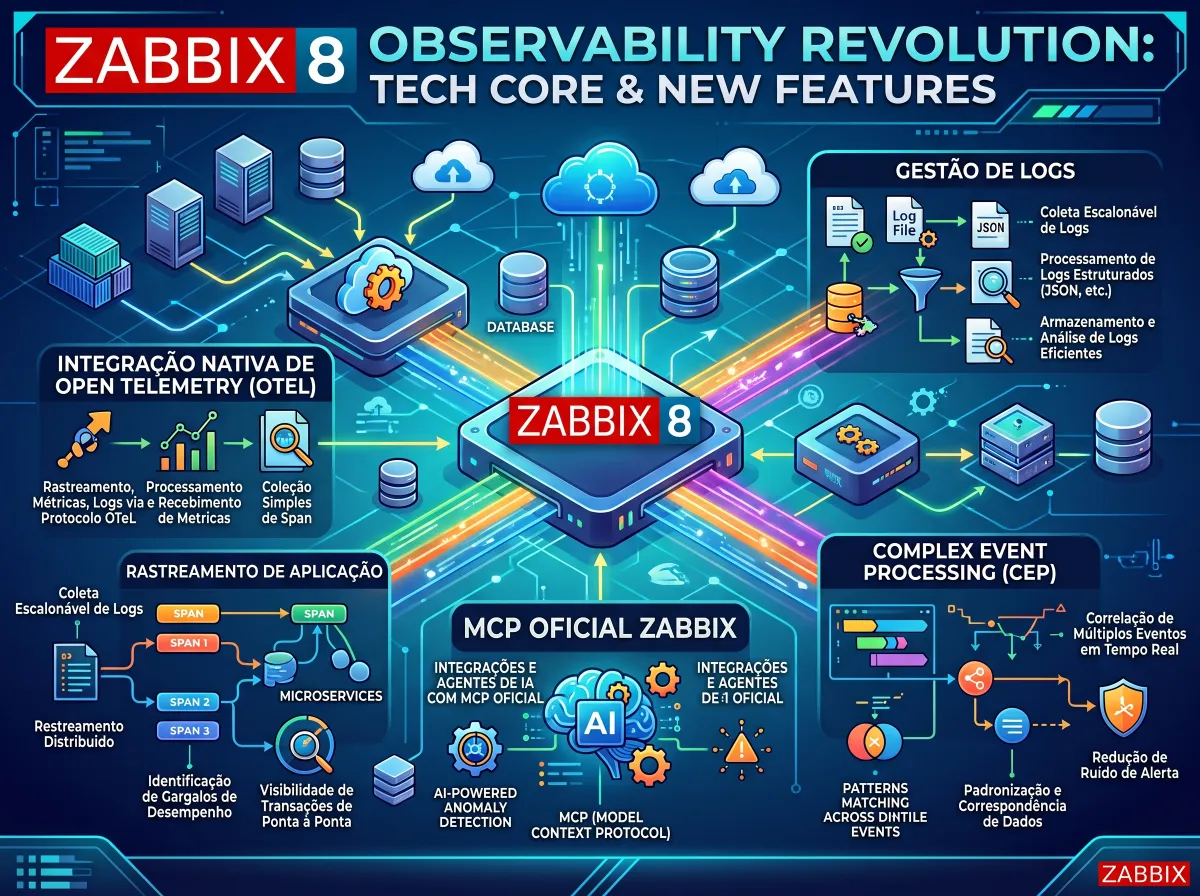
Every Zabbix LTS version carries a different weight from the others. It is the version companies install and keep for years, the one that goes into contracts, public tenders, and reference architectures. So when Zabbix itself opens its annual event with a talk by the founder titled something like “Zabbix 8.0: redefining observability,” it is worth paying attention. The version is planned for October 2026, and the block of novelties that stands out most on the roadmap is not about a new widget or one more template: it is about changing the nature of the product.
For more than two decades, Zabbix was built around metrics. An item collects a value, a trigger evaluates an expression, an event is born, an action fires. This model is robust, predictable, and explains why Zabbix is in banks, carriers, public agencies, and industries around the world. But it always had a blind spot: what happens inside the application, in the journey of a request that crosses ten microservices, and what happens between events, when a hundred alerts are actually a single problem.
Zabbix 8.0 attacks exactly these two blind spots, and adds a third move: opening the platform so that artificial intelligence agents can talk to it natively. In this first article of the series on (PT) Zabbix 8.0 LTS, we will break down the four fronts that make up this block (OpenTelemetry, log-based observability, the new complex event processing engine, and the official MCP server), looking at the practical effect of each, at real usage scenarios, and at what this means in the observability market today.
Note on the status of these features. At the time this text was written (late September 2026), the latest public version of 8.0 was beta2, from July. OpenTelemetry, complex event processing, and the MCP server appear on the official roadmap as “in development” and were not yet in the public release notes. The development tickets for OpenTelemetry and the event engine, however, are marked for the 8.0 release candidate, and the events one is already in the documentation phase. In other words: the signal is strong, but implementation details may change until the final version. Here we deal with what is planned, not with what is already installed in production.
OpenTelemetry: Zabbix enters the world of traces
If there is a consensus in modern observability, it is called OpenTelemetry. The CNCF (Cloud Native Computing Foundation) project has become the open standard for instrumenting applications and collecting metrics, logs, and traces in a vendor-neutral way. Grafana Labs’ annual observability survey, published in 2026 with more than 1,300 responses, shows that most respondents already use OpenTelemetry for metrics, half use it for traces, and almost half for logs, with growth on every front compared to the previous year. Another relevant cut of the same survey is the number of organizations still in the proof-of-concept or investigation phase with OpenTelemetry: a large pipeline of companies preparing to scale.
The Zabbix 8.0 roadmap brings two deliverables in this field. The first is native, scalable OpenTelemetry data collection designed for cloud native environments. The second is a new visualization dedicated to searching and analyzing traces. Both are among the most voted items by the community. The development ticket itself explains the motivation bluntly: Zabbix was designed for metrics and did not handle debugging and profiling information well, such as traces and logs; bringing traces into the platform, and especially correlating them with infrastructure metrics, would open the way to more sophisticated methods of problem detection and resolution.
In practice, the most important effect is not “Zabbix now shows traces.” Specialized tools have done that for years. The effect is that the trace comes to live in the same place where the host, the database, the network link, the storage, and the incident history already live. Think of an e-commerce site on the eve of Black Friday: checkout starts to slow down, and the application team sees in the trace that the inventory query span jumped from 40 to 900 milliseconds. In a fragmented scenario, someone opens a ticket for the database team, which opens another for infrastructure, which discovers after an hour that the storage volume had high write latency. When trace and infrastructure metric sit side by side, with the same tag model and the same event engine, that bridge shortens drastically.
Another very common scenario in Brazil is that of financial institutions and fintechs that operate critical transactional flows, with aggressive response-time targets. In these environments, it is common for infrastructure monitoring to be done in Zabbix and application monitoring in a commercial APM tool charged per host or per data volume. The arrival of OpenTelemetry in Zabbix does not automatically eliminate the dedicated APM, but it changes the cost and architecture conversation: instrumentation done in OpenTelemetry is portable, and having an open source backend able to receive it gives the company the power of choice. The session on Zabbix’s new APM capabilities at Summit 2026 goes in exactly this direction, promising end-to-end visibility over distributed systems using the OpenTelemetry standard.
Logs as a first-class signal
Zabbix has monitored logs for a long time. log[], logrt[], and eventlog[] items are old acquaintances of anyone who administers the tool. But the model was always to look for a pattern and turn that occurrence into a value for a trigger, with the log as a trigger, not as a source of investigation.
The 8.0 roadmap talks about log-based observability, with a focus on real-time monitoring and troubleshooting using the information contained in logs to understand the behavior and health of systems. And for 8.2, planned for March 2027, the promise goes further: centralized log management, syslog collection, and an advanced analysis interface. This suggests a two-stage strategy, in which 8.0 lays the foundation and 8.2 delivers the full log management experience.
The practical effect of this change shows up the moment an alert fires. Today, the typical flow of a NOC analyst is to receive the alert in Zabbix, open an SSH session or another log tool, look for the right time range, and try to find the cause. With logs treated as a first-class signal, the investigation starts in the event itself. For carriers and regional providers, which are a huge part of the Zabbix user base in Brazil, this has immediate value: syslog from routers and switches, BGP flap messages, and logs from PPPoE concentrators and OLTs stop being a separate world.
All of this depends on a less glamorous but decisive piece: storage. Traces and logs generate volumes that traditional relational databases were not built to support. The roadmap plans support for new storage engines optimized for large volumes of traces, logs, time series, and streaming data, and the first concrete materialization of this is already in the 8.0 documentation: ClickHouse as a backend for item history. We will go deeper into this topic in the second article of the series, but it is worth noting here that without this data layer the observability ambition does not hold up.
Complex Event Processing: the end of the alert storm?
If we had to pick a single Zabbix 8.0 novelty to highlight for its impact on day-to-day operations, it would be this one. The complex event processing (CEP) engine is described on the roadmap as a way to fully automate event handling: change tags and severity, filter, deduplicate, automatically close events that have become obsolete, apply time-window-based logic, do advanced pattern matching with custom JavaScript processing, anonymize data, and more. The roadmap text itself mentions that this enables Zabbix for scenarios such as fraud detection, SIEM-style security monitoring, and event correlation.
The specification published in the development ticket helps in understanding the design. There are two modes of operation. In the first, the rules act event by event, normalizing and enriching: discard, close, or suppress an event, add, modify, or remove tags. In the second, the rules work over a set of events within a time window, which allows four things Zabbix never did natively and elegantly. The first is deferred processing, such as raising severity or closing an event after a period of inactivity. The second is grouping, which includes deduplicating and counting triggers that keep flipping between problem and OK. The third is pattern detection, in which a combination of events that meets a criterion generates a new event. The fourth is absence detection, which fires an alert when an expected event does not happen within a period. The same ticket makes another goal clear: replace the current global event correlation with this new engine, with better performance at large volumes.
To understand the size of the change, one must remember how correlation is done in Zabbix today. We have trigger dependencies, which work well for simple, stable topologies and become a maintenance nightmare in dynamic environments. We have tag-based correlation within the trigger itself, useful for closing related problems. We have global correlation, powerful in concept but limited in expressiveness and known to be heavy at large volumes. And, since 7.0, we have the cause and symptom problem model, which helps with visualization but depends heavily on manual tagging or external automation. Anyone who has needed something more sophisticated ended up placing an additional layer between Zabbix and the operations team: an event orchestrator, a commercial AIOps platform, or, often, custom scripts consuming the API.
Now imagine the scenarios. At an internet provider, an aggregation switch goes down and, within seconds, two hundred customer devices become unreachable. With time-window grouping rules, those two hundred events can be consolidated around the cause event, with enriched tags indicating the POP and the affected segment, and the team receives an incident with context instead of an avalanche. In a corporate environment, a CPU usage trigger that flaps every five minutes stops generating twenty notifications per hour and generates one, with the occurrence count recorded. In a nightly backup routine, the absence rule fires when the job does not report success by six in the morning, which today requires tricks with nodata() and trapper items. And in security, five authentication failures on different hosts, for the same user, within ten minutes, can become a new event of a possible brute-force attack, with sensitive data anonymized before moving on to an external tool.
This kind of capability is exactly what the AIOps market sells as its main benefit. Vendors in the sector advertise alert volume reductions in the range of 80% to 95% after deploying correlation, numbers that should be read as marketing material but that point to a real pain. NeuBird AI’s 2026 report on production reliability indicates that 77% of on-call teams receive at least ten alerts per day and that 57% say that less than 30% of those alerts are actionable. Not by chance, Summit 2026 dedicates a talk and an entire workshop to the topic, focused on root cause analysis, deduplication, and event enrichment, in addition to a specific session on the role of tags in complex event processing.
This last point deserves emphasis, because it is where many deployments will stumble. CEP operates on tags. Environments where tags were created without a standard, with inconsistent names and free-form values, will discover that the most powerful engine in the world does not fix a messy data model. It is no coincidence that the same 8.0 brings the visibility of tags inherited from templates and hosts in items and triggers and the ability to edit tags of triggers created by low-level discovery. Tag taxonomy stops being good practice and becomes a prerequisite.
Zabbix MCP Server: the official door for AI agents
The Model Context Protocol, or MCP, is an open standard that allows AI assistants and agents to use external tools in a structured way. Instead of someone copying and pasting Zabbix data into a chat, the agent queries the platform directly, with defined permissions. The 8.0 roadmap announces an official Zabbix MCP server, described as the way for AI agents to query monitoring data programmatically, manage alerts and events, and access configuration information directly from the instance. It is another item among the most voted by the community.
It should be said that the community did not wait. Open source MCP servers for Zabbix already exist, some covering practically the whole API, with read-only modes, token authentication, and experimental support for 8.0 itself. The difference of an official version lies in three points: guaranteed support and compatibility with each new version, alignment with the product’s permission model, and the trust that a security area demands before allowing an AI agent to talk to the system that sees the company’s entire infrastructure.
The usage scenarios show up quickly. An on-call analyst at three in the morning asks the assistant which problems are open on the database cluster, what changed in the last two hours, and whether there are similar events in the history, and receives a natural-language summary with links to the events. A manager asks for an availability report of the month’s critical services, cross-referenced with the longest incidents. An engineer asks the agent to list all hosts without an operating system template linked or with unsupported items for more than seven days. And, in more mature flows, an agent receives the event enriched by CEP, queries the context via MCP, suggests the diagnosis, and opens the ticket already with the preliminary analysis.
It is important to see the complementarity between CEP and MCP. The event engine is deterministic: explicit, auditable rules with predictable behavior. The AI agent is probabilistic: great for interpreting, summarizing, and suggesting, but subject to error. A healthy architecture uses CEP to reduce noise and structure the signal, and AI to speed up human understanding of that already clean signal. Having a language model read a storm of ten thousand raw events directly is expensive, slow, and unreliable.
And there is, of course, the question of governance. An MCP server that can manage alerts and events is, in practice, a credential with the power to act on monitoring. Questions such as which user and which role the agent will use, whether it will have write or only read permission, where data travels when the AI model is an external service, and how the agent’s actions appear in the audit must be answered before the first test in production. The roadmap points out that AI does not stop at 8.0: 8.2 promises “AI tools,” native AI-driven features, and 9.0 brings new anomaly detection functions, reinforcing the guideline of continuing to add AI capabilities to the experience and to data processing.
Why this matters now
The observability market lives with a clear tension. On one side, the complexity of environments has grown with cloud, containers, third-party APIs, SaaS, and now applications with embedded AI. On the other, the bill for commercial observability platforms, usually charged per host, per ingested volume, or per user, has become a board meeting topic. Elastic’s observability trends report for 2026 points out that generative AI and OpenTelemetry have stopped being differentiators and become basic criteria in choosing platforms: those who do not invest on these fronts tend to fall behind.
It is in this scenario that Zabbix 8.0 positions itself. Not as an instant replacement for all specialized tools, but as an open source platform, with no license cost, able to concentrate metrics, events, traces, and logs, correlate them natively, and expose them to AI agents through a standard protocol. For companies that already have Zabbix as the heart of infrastructure monitoring, and in Brazil that is a huge share of the market, the step up can happen without changing tools, by evolving the one that already exists.
The expert’s view
To understand the size of the leap Complex Event Processing represents, just look at how event correlation is done today in most Zabbix environments. It is, essentially, manual. The analyst opens the problems console and marks, event by event, which is cause and which is symptom. When they need to take noise off the screen for a while, they use manual event suppression. And the correlation that happens before the problem, in a preventive way, depends on trigger dependencies that someone configured by hand, based on relationships that were already known. It works, but it depends on the knowledge and time of whoever operates, and it does not scale at the same speed as the environments.
What CEP promises is to turn this manual work into rules. The knowledge that today lives in the head of the experienced analyst, the one who knows that the failure of a certain device takes down fifty others, can now be expressed in logic that Zabbix itself runs continuously. This, to me, is one of the most important moves of the version.
On OpenTelemetry, my position is one of caution. It is a strategic and very welcome evolution, but it still needs to be well tested and evaluated before we know whether Zabbix can replace more robust market tools specialized in APM and tracing. It is one thing to bring traces into the platform; it is another to sustain volume, depth of analysis, and investigation experience at the level these environments demand. That answer will come from practice, not from the roadmap.
The official MCP server, in turn, changes something fundamental: AI stops being an accessory and becomes something closer to a native Zabbix feature. Until now, everything that existed in this integration were isolated community initiatives, some very good, but always with the question of compatibility, support, and trust hanging in the air. With an MCP maintained by Zabbix itself, the use of AI becomes integrated into the product, and that tends to speed up adoption in companies.
And what is the role of AI in this scenario? In my view, it should act in the intelligent automation of the environment, not just answer questions. But that requires a lot of governance over what it can and cannot do: which actions are allowed, with which permissions, under what supervision, and with what record. And there is a point that is not negotiable: the analyst remains responsible for what the AI does. Automation changes the work, but does not transfer responsibility.
Finally, on the upgrade. In production, the good practice is already to wait a bit after a new version is released. In the case of 8.0, given the number and depth of the changes, the recommendation is to wait even longer. The path is to do a careful evaluation in a test or staging environment and explore the new features well in a lab before taking anything to production. We should not be in a hurry. And, meanwhile, here is the message for those who work with monitoring: it will be necessary to learn the new features and the new Zabbix interface to stay up to date. The lab is not only for validating the upgrade; it also serves for professionals to prepare to operate this new generation of the tool.
Conclusion
Zabbix 8.0 is not just another version with new features. It is the version in which Zabbix stops being only a metrics-based monitoring system and starts competing for space as a complete observability platform, with traces, logs, intelligent event correlation, and native integration with AI agents. Not everything will be mature on day one, and it is healthy to treat the roadmap as a roadmap until the binary is available. But the direction is clear, and the companies that start preparing now will be ahead when these capabilities reach production.
In the next article of the series, we will look at what supports all this ambition: the performance, scalability, and high availability improvements of the core, the new data types and the new storage model with ClickHouse, and what really weighs at upgrade time.
Sources
- Zabbix Roadmap (official)
- What’s new in Zabbix 8.0 — official documentation (development version)
- ZBXNEXT-10353 — Complex Event Processing (CEP)
- ZBXNEXT-10084 — Trace collection and analysis (OpenTelemetry)
- Zabbix Summit 2026 — agenda
- everyWAN — Zabbix 8.0: what is real and what is still roadmap (Jul/2026)
- Grafana Labs — Observability Survey 2026
- Elastic — Observability trends for 2026: GenAI and OpenTelemetry
- Clanker Cloud — data from the NeuBird AI 2026 report on alert fatigue
- initMAX — Zabbix MCP Server (community, open source)
About Target Solutions
Target Solutions has spent more than 15 years helping organizations evolve their infrastructure, monitoring, observability, automation, and operational intelligence operations. Across that journey, it has participated in projects in complex environments such as telecom, technology, government, energy, and large enterprises, helping increase operational efficiency and service reliability. As a Zabbix Certified Partner in Brazil, Target Solutions supports the deployment, evolution, sustainment, and optimization of enterprise Zabbix environments, integrating monitoring with ITSM, observability, and operational processes at scale.
About the author
Luciano Souza, Associate Consultant at Target Solutions.