
Zabbix
After Zabbix 8.0: where the roadmap is heading toward 9.0 LTS
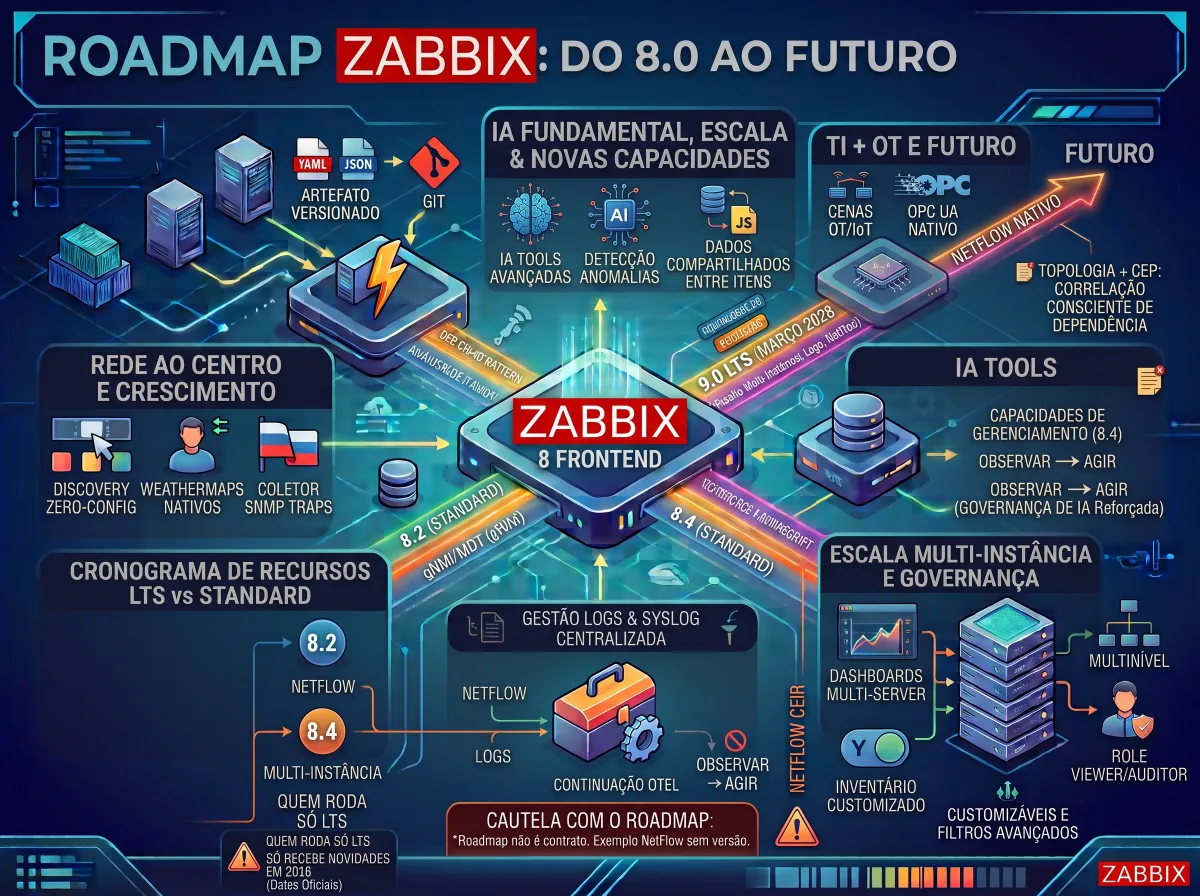
In the first three articles of this series (Part 1, Part 2, and Part 3), we looked at Zabbix 8.0 LTS: observability and artificial intelligence, the performance and data core, and the new user experience. In this last one, the question changes. It is no longer “what arrives in October?” but “where is the product heading?”.
Zabbix’s public roadmap answers that question with a level of transparency few vendors offer. It lists features planned for version 8.2, scheduled for March 2027, 8.4, for September 2027, and 9.0 LTS, for March 2028, along with general guidelines that repeat from version to version. Read item by item, it looks like a wish list. Read as a whole, it reveals a clear strategy.
Before we start: a roadmap is not a contract. Zabbix itself warns, at the top of the page, that the list is provisional and may change at any time: features can be added, removed, or moved between versions, and the removal of an item does not mean loss of interest. Some long-standing requests cited here, such as NetFlow collection, do not even have a defined version in the official tracker so far. Everything that follows is a reading of direction, not a promise of delivery.
Understanding the calendar: LTS, standard versions, and what this means for you
Before looking at the features, it is necessary to understand the pace. Under Zabbix’s lifecycle policy, an LTS version is released every year and a half and has five years of support: three years of full support and two of limited support, with critical fixes only. Between two LTS releases, two standard versions come out, every six months, with support of about twelve months. For 8.0 LTS, the forecast is full support through the third quarter of 2029 and limited support through the third quarter of 2031. Version 8.2 will have full support through the third quarter of 2027 and limited support through the first quarter of 2028.
This has a practical consequence that rarely shows up in roadmap discussions. Most companies run only LTS versions in production, precisely for stability and long support. For those companies, the novelties planned for 8.2 and 8.4 only actually reach production with 9.0 LTS, in 2028. Anyone who wants NetFlow, centralized log management, or multi-instance dashboards before then will have to decide whether it is worth adopting standard versions, with much more frequent upgrade cycles. It is an architecture and operations decision, not just a feature one.
First vector: the network returns to center stage
The most robust block of 8.2 is dedicated to network monitoring, and that says a lot. Zabbix was born strong in infrastructure and networking, and the roadmap shows the company wants to reinforce that territory rather than abandon it in the name of application observability.
The first item is the collection and visualization of NetFlow data, with bandwidth usage, identification of the biggest traffic consumers, and mapping of communication between devices. It is one of the oldest and most voted requests in the product’s history: the original ticket was opened in 2009 and has accumulated more than a hundred votes. Today, anyone who needs to know not only that a link saturated but who saturated it resorts to a parallel flow analysis tool. Bringing this inside Zabbix closes the question every network analyst asks right after the alert. It is worth remembering, however, that this request still has no defined version in the tracker, so it is one of the items to follow with the most caution.
The second is automatic discovery and intuitive visualization of layer 2 and 3 devices and topology, presenting the network structure in graphical format, with device status and identification of problems in real time. In the same package are a specific widget for devices with many interfaces, such as switches and routers, and weathermaps, the network maps with a visual indication of link load, another very old request from the community. In the core, 8.2 plans general-purpose topology information processing. This technical detail is the most important of all: a Zabbix that understands who is connected to whom can use that information to correlate events far more precisely. It is the natural meeting point with the complex event processing engine we discussed in the first article.
The third is real-time data collection by streaming, with support for protocols such as MDT (model-driven telemetry) from the main vendors. This movement follows a transition already under way in the networking market: instead of the monitoring system querying the equipment at fixed intervals, as with SNMP, the equipment itself continuously sends structured data, with granularity of seconds and without missing short events between one query and the next. For carriers and providers with large backbones, it is the difference between seeing a microburst or not.
Completing this vector are the new generation of intelligent network discovery, with the proposal to discover devices, applications, and cloud services without configuration and start monitoring right after installation, planned for 8.2, and the native SNMP trap collector, planned for 8.4. The latter eliminates the dependence on third-party software, such as snmptrapd with helper scripts, which today is one of the most fragile parts of many installations, especially with SNMPv3.
Second vector: full observability, from trace to log
8.0 opens the door to OpenTelemetry and to logs as a first-class signal. The roadmap for the following versions shows that this door will not stay only ajar. 8.2 promises centralized log management, including syslog collection and an advanced analysis interface, in addition to continuing to expand OpenTelemetry and observability capabilities. Also in 8.2 appears security and compliance monitoring as an out-of-the-box capability.
Putting these pieces together with what comes in 8.0, a coherent picture forms: metrics, events, traces, and logs on the same platform, correlated by the same engine and accessible through the same interface. It is the much-talked-about “single pane of glass” that the market has sold for years, built on an open source foundation. The challenge, and here we must be honest, is one of maturity. Tools specialized in logs and traces have years on the road. Zabbix will need to prove, version after version, that it can deliver depth and not just coverage.
Third vector: from observation to action
This is perhaps the most transformative vector, and the least discussed. 8.4 plans what the roadmap calls management capabilities: the ability to run active operations, manually or automatically, on monitored objects. Until now, Zabbix’s philosophy was essentially to observe and alert, with actions limited to scripts and remote commands. With native management capabilities, Zabbix takes on an active role in operations: restarting a service, changing a state, triggering a corrective routine.
This movement connects directly with AI. 8.2 brings “AI tools,” new features driven by artificial intelligence still without public detail. 9.0 LTS brings new trigger functions for advanced anomaly detection in IT and OT environments. And the general guidelines repeat, in every version, the commitment to keep adding AI to the user experience and data processing. Adding up the MCP server of 8.0, event processing, anomaly detection, and actions on monitored objects, the design that emerges is that of a platform that detects, understands, suggests, and, within defined limits, acts.
On the technical level, two core items of 8.2 support this evolution: a new JavaScript engine, with support for the latest language standard, for more efficient preprocessing and customization, and the ability to share data among several items, such as a session key obtained once and reused by several collections. They are discreet improvements, but ones that make integrations with modern APIs much cleaner and more efficient.
As we discussed in the first article, the more the platform acts, the more important governance becomes. Who can trigger an operation, under which conditions, with what record, and under whose responsibility are questions teams will need to answer before turning this kind of feature on in production.
Fourth vector: organizational scale and multi-instance view
Large organizations rarely have a single Zabbix. There are instances per region, per business unit, per customer, per environment. 8.4 tackles this scenario with dashboards capable of viewing data from multiple Zabbix instances, another of the most voted items. It is the native answer to a need that is today solved with external visualization tools or API integrations.
In the same vein appear multilevel dashboards with easier navigation, favorite dashboards, better visibility of dashboards at the host level, filters shared among users, and the ability to keep the official templates updated directly from the interface. Customizable inventory fields, an old and highly voted request, are also planned for 8.4. In 9.0, template dashboards applicable to multiple hosts and dynamic widgets based on prototypes arrive, allowing advanced visualizations that adapt automatically to what was discovered.
For governance, 9.0 brings the Viewer, or Auditor, user role, with read-only access to configuration. It seems simple, but it is an old demand from audit, security, and compliance areas, which need to inspect how monitoring is configured without having any permission to change it.
Fifth vector: IT and OT on the same platform
The general guideline that closes each roadmap version is explicit: keep evolving Zabbix to be the definitive monitoring and observability platform for IT and OT environments, the operational technology of factories, utilities, buildings, and physical infrastructure. 8.2 brings the creation of custom scenes for visualizing OT and IoT environments, and 9.0 LTS plans support for new industrial protocols, such as OPC UA, an open standard for communication between equipment from different vendors.
This movement follows a strong market trend. IT and OT convergence stopped being trade-show talk and became a project in sectors such as energy, sanitation, mining, agribusiness, and manufacturing. 2026 market guides highlight that OT environments require lightweight or agentless collection, through protocols such as SNMP, OPC UA, vendor APIs, or industrial gateways, so as not to disturb sensitive production systems. Zabbix is already used in many of these scenarios, as shown by cases presented at Summit 2026, ranging from sensors embedded in concrete to telescopes and power grids with tens of thousands of remote devices. The roadmap indicates that Zabbix wants to turn this creative use into native capability.
The strategic reading: consolidation, open standards, and AI
Placing the five vectors side by side, the Zabbix roadmap responds to the three forces that dominate the observability market in 2026.
The first is tool consolidation. Surveys by vendors in the sector indicate that the vast majority of organizations are seeking or considering consolidating their monitoring tools, and that a significant share of IT leaders admit to switching platforms in the next one or two years. Numbers from vendor-run surveys need to be read with caution, but the direction is consistent: fewer tools, more integration. NetFlow, logs, traces, topology, multi-instance view, and OT are exactly the domains that today force companies to keep tools parallel to Zabbix.
The second is open standards. OpenTelemetry, MCP, OPC UA, model-based streaming telemetry: the roadmap bets on open, interoperable protocols, not on proprietary formats. This is consistent with Zabbix’s open source nature and is a strong argument for organizations that want to avoid vendor lock-in.
The third is artificial intelligence, present as a guideline in every version, but with a characteristic worth highlighting: it always appears accompanied by foundations. A deterministic event engine, analytical storage, structured data, topology, and permissions. It is a slower path than simply putting a chatbot in the interface, but a much more solid one.
The risk of this strategy is scope. The more domains Zabbix embraces, the greater the challenge of delivering depth in each of them and of keeping the simplicity that has always been one of its strengths. The next two years will show whether Zabbix can balance breadth and maturity.
The expert’s view
Looking at the post-8.0 roadmap, I see the evolutions in network monitoring as the big highlight. NetFlow and automated topology are additions that should further expand the use of Zabbix for network monitoring, a territory where it is already very strong. Combined with syslog collection, these novelties take observability to the infrastructure level, not just the application level. It is a vision of observability that speaks directly to the reality of those who operate networks and data centers, such as MSPs.
At the public-sector company where I have worked for two decades, we have used an in-house solution to collect data via NetFlow for many years. In large private companies, this scenario is filled by market enterprise products, which cost a good amount of money. With Zabbix evolving in this segment, those scenarios could be transformed with a tool that covers more and more infrastructure and application data and stays open.
IoT and OT represent a broadening of scope in the use of Zabbix, even though there are already several use cases in these segments. The difference is that what today depends on creativity and integrations gains native support. As a result, the areas most positively affected by these novelties are the segments tied to services and industry.
On artificial intelligence, as in several other areas, it is a path of no return. From here on, we will have more and more AI-related capabilities in Zabbix and in the observability ecosystem as a whole. And, as I argued in the first article of this series, the more the platform starts to act, the more governance will be needed, and the analyst remains responsible for what the automation does.
Finally, on the choice between LTS and intermediate versions. For highly regulated companies, where vendor support is a compliance item, staying on LTS is the way. But for those with urgency for the new features and driven by innovation, it is worth using the intermediate versions, always after testing in a lab. The decision is not only technical: it depends on each organization’s risk profile and strategy.
Series conclusion
Over these four articles, we followed a transformation under way. Zabbix 8.0 LTS brings observability with OpenTelemetry and logs, intelligent event correlation, native integration with AI agents, a core prepared for scale, new data types, analytical storage, simpler high availability, a more productive interface, and an official mobile app. And the roadmap through 9.0 LTS shows that this is only the starting point of a larger movement: networking with flow and topology visibility, log management, a platform that starts to act, a consolidated view across instances, and a firm entry into the world of operational technology.
For companies, the message is twofold. There is a lot of value to capture, but it depends on preparation: testing, training teams, reviewing architecture and data models, and defining governance for automation and AI. Zabbix is moving to a new level, and those who start preparing now will reap the results first.
Sources
- Zabbix Roadmap (official)
- Zabbix Lifecycle and Release Policy
- ZBXNEXT-37 — NetFlow data monitoring
- ZBXNEXT-5703 — Receiving SNMP traps without snmptrapd
- Zabbix Summit 2026 — agenda
- LogicMonitor — 2026 Observability & AI Outlook
- Checkmk — Hybrid IT Monitoring Buyer’s Guide 2026
- WWT — Modernizing Network Observability: SNMP to Streaming Telemetry
About Target Solutions
Target Solutions has spent more than 15 years helping organizations evolve their infrastructure, monitoring, observability, automation, and operational intelligence operations. Across that journey, it has participated in projects in complex environments such as telecom, technology, government, energy, and large enterprises, helping increase operational efficiency and service reliability. As a Zabbix Certified Partner in Brazil, Target Solutions supports the deployment, evolution, sustainment, and optimization of enterprise Zabbix environments, integrating monitoring with ITSM, observability, and operational processes at scale.
About the author
Luciano Souza, Associate Consultant at Target Solutions.