
Zabbix
Zabbix 8.0 LTS on screen: new interface, widgets, versionable dashboards, and the official mobile app
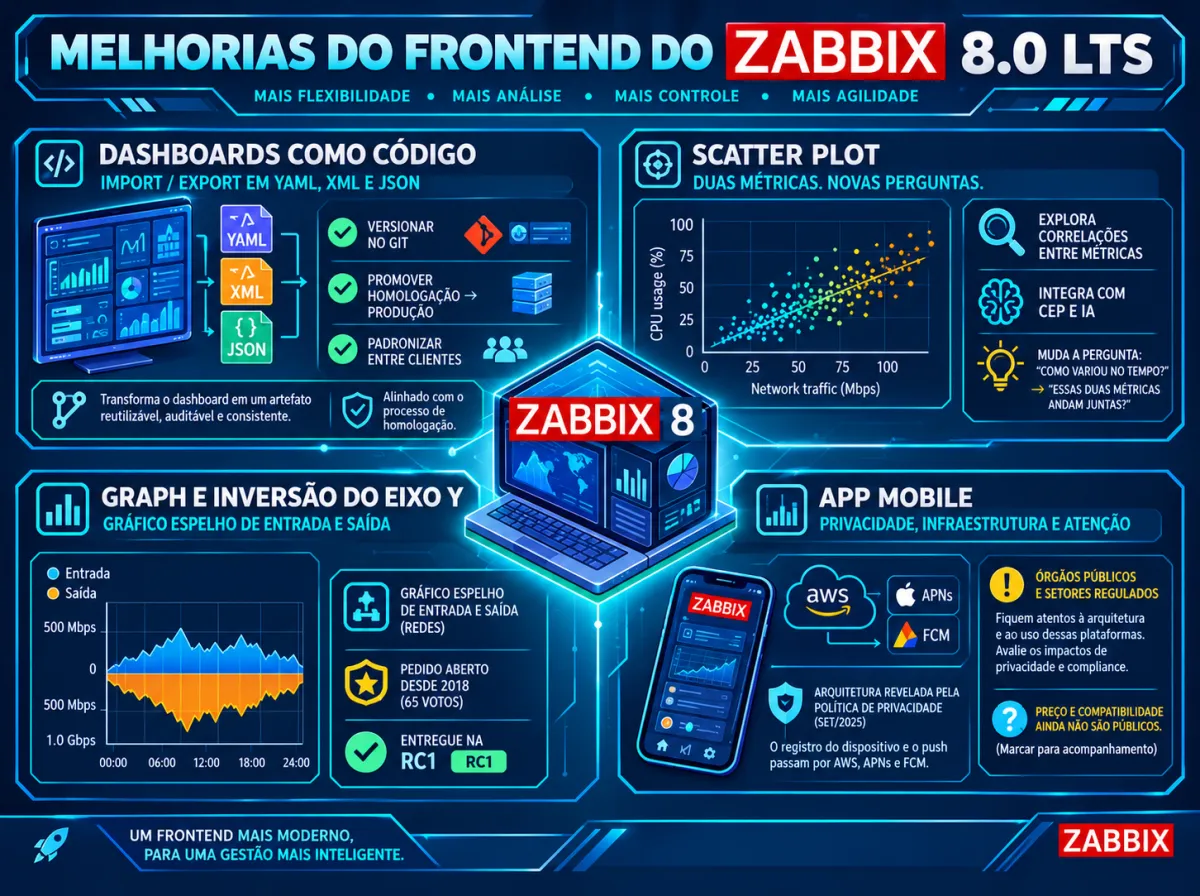
In the first two articles of this series (Part 1 and Part 2), we looked at what Zabbix 8.0 brings that is new in observability and artificial intelligence and at the core that supports all of it. Now it is the turn of the layer everyone sees: the interface. And it is a mistake to treat this topic as cosmetic. For someone in the NOC at three in the morning, the number of clicks to reach the right data is response time. For someone who manages dozens of dashboards, the ability to replicate them across environments is productivity. And for someone on call, receiving the alert on the phone with enough context to act is the difference between solving it from bed or rushing to the laptop.
Zabbix 8.0 has a large volume of changes in this layer. Some are long-standing community requests finally met, others open new ways of working. And there is the official mobile app, one of the most voted novelties on the roadmap, which will be launched together with the version.
Feature status. Most of the interface novelties in this article are already in the official 8.0 documentation and were delivered in the alpha, beta, and RC1 versions, such as the dark blue theme, customizable tables, Scatter plot, improvements to the Graph widget, (PT) dashboard import/export, inline validation, modal forms, and putting triggers into ad-hoc maintenance. The mobile app still appears as “coming soon” on the official site, with a launch planned together with 8.0.
An interface that adapts to those who operate it
The change with the biggest impact on day-to-day work is perhaps the simplest to explain: customizable tables. On the Problems, Latest data, and Hosts screens, in the monitoring section, and in the host and template lists, in data collection, it is now possible to hide, reorder, and resize columns. It is also possible to add a custom text column, filled with fixed text, macro values, or both. Some columns gain an options button that controls how data is displayed, and part of the parameters that used to live in the filter moved to these column options. This item was among the most voted by the community.
The practical effect is that each user profile comes to see what matters to them. A NOC analyst can reduce the problems screen to the severity, host, and duration columns and a custom column with the responsible person’s contact macro or the customer code. A database team can highlight, in Latest data, the columns that make sense to them. A provider serving several customers can display, next to each host, a macro with the contract identifier. It is the end of the one-size-fits-all interface.
A warning for those about to upgrade: since some filter parameters were moved to column options, anyone who uses favorite filter tabs on the problems screen should review those settings after the upgrade.
Along the same lines, 8.0 brings a new theme, dark blue, new built-in fonts, and accessibility improvements. Configuration forms now open in modal windows and gain inline validation, with errors pointed out in real time, field by field, instead of a generic message after clicking save. Tags inherited from templates and hosts become visible in items and triggers, event details now show the reason for suppression, and global regular expressions gain a modal form, filtering by name and description, and the ability to export and import. The roadmap also mentions a general usability review of the existing screens and forms.
Individually, each item seems small. Added up, they reduce the friction for those who configure and operate Zabbix every day. And they have an effect that directly interests teams: a tool that is easier to use requires less training for new analysts and generates fewer configuration errors.
Widgets and graphs: answering questions faster
The Graph widget, the main chart of Zabbix’s modern dashboards, receives a set of improvements the community had been asking for since 2018. The original request gathered 65 votes and was delivered in 8.0 alpha2. Among the changes are a more useful tooltip, with sorted values and the time displayed; new legend options; a color algorithm with more distinct colors between series; a clear way back after a zoom; and the ability to invert the Y axis, multiplying values by minus one without changing the original data.
It sounds like a detail until someone needs to compare inbound and outbound traffic of a link on the same chart. With inversion, inbound sits above the axis and outbound below, in the mirrored format any network engineer recognizes immediately. And the tooltip sorted by value solves the common situation of a chart with twenty series in which you need to find out, in seconds, which one is on top.
The most interesting new widget is the Scatter plot. It plots the relationship between two metrics, each point positioned by one value on the X axis and another on the Y axis, and with that it reveals patterns, clusters, correlations, and outliers. It is a type of visualization that changes the question you ask of the data. Instead of “how did this metric vary over time?”, it becomes “do these two metrics move together?”. Number of connections against CPU usage in a pool of web servers, latency against request volume in an API, temperature against power consumption in a rack: when a point shows up isolated from the group, that is where the server behaving differently from the others is. It is no coincidence that this widget arrives in the same version that brings complex event processing and the opening to AI agents. It is a visual analysis tool, not just a tracking one.
Completing the package are the clustering control of markers in the Geomap widget, useful for those who monitor geographically distributed infrastructure, aggregated columns in the Top items widget, a higher character limit in widget descriptions, adjustments to the time zone of the Clock widget, and a slideshow setting for dashboards. The roadmap also plans the ability to maximize a widget, expanding it to take up all the dashboard space. It is a request that has existed since 2018 and is marked for the release candidate, but had not yet been delivered at the time this text was finalized.
Dashboards as artifacts: export, import, version
Among the visual changes, this is the one that most alters the way of working. Zabbix 8.0 allows exporting and importing dashboards, in YAML, XML, and JSON formats, and the roadmap also highlights the ability to copy and paste widgets and dashboards between systems. This was one of the most voted requests in the whole history of the product.
Until now, a dashboard was something built by hand, click by click, that lived only inside an instance’s database. Taking a dashboard from staging to production meant rebuilding it or resorting to scripts via the API. Replicating the same panel for twenty customers of a service provider was manual labor. With export, the dashboard becomes a file. And a file can be versioned in Git, reviewed before going into production, reused across environments, and distributed as part of a standard monitoring package.
This brings Zabbix closer to a practice already common in other layers of infrastructure: treating configuration as code. Templates could already be exported for a long time; now dashboards enter the same logic. For consultancies and teams that standardize deliverables, the gain is immediate. For those who maintain serious staging environments, as we discussed in the previous article about the upgrade, it is one more piece that can now be tested before reaching production.
Ad-hoc maintenance: acting on the problem without leaving the screen
An old pain for those who operate a NOC is the trigger that keeps flipping between problem and normal. Today it is already possible to manually suppress a problem, but when it resolves and fires again, a new event appears. The alternative is to create a maintenance period, which requires leaving the problems screen, configuring hosts or tags, and defining schedules. That is unworkable at the pace of an on-call shift.
The 8.0 roadmap plans the action of putting selected or filtered problems into maintenance with one click. The originating request describes exactly the scenario: suppress all events of a trigger for a given period, straight from the problem update window, without having to touch the maintenance registry. The feature was in testing, planned for the release candidate.
It is a change that brings the interface closer to how a NOC really works. But it is also a tool that calls for a usage policy. Suppressing events with one click is great for dealing with a trigger flapping during a known intervention, and dangerous if it becomes a shortcut to hide problems nobody wants to investigate. The good news is that 8.0 itself now shows the reason for suppression in the event details, which helps maintain traceability.
The official mobile app
For years, anyone who wanted to use Zabbix on a phone had two options: access the web interface through the phone’s browser, impractical on a small screen, or resort to third-party apps, some quite mature but without the seal of an official product. The 8.0 roadmap brings Zabbix’s official mobile app for iOS and Android, with push notifications, access to problems and historical data, and problem management functions, launched together with the LTS version. It was one of the most voted items by the community.
The app’s official page is still in “coming soon” mode, but the privacy policy published in September 2026 reveals a lot about how it works. The app does not create a separate account: the user signs in with the credentials they already have on a Zabbix Server or Zabbix Cloud, granted by the administrator. There is a registration process that links the device to a server, using the camera only to read a QR code. The device’s own biometric authentication is supported, without Zabbix receiving biometric data. Push notifications are delivered by the platforms’ services, such as the Apple Push Notification service and Firebase Cloud Messaging. And the infrastructure supporting the app runs on AWS, with data handled within the European Economic Area. The document also states that the app does not create or keep a separate copy of the monitoring data accessed through it.
The usage scenario is that of any on-call team. The analyst on call receives the notification, opens the problem in the app itself, checks the metric history, acknowledges the event, and writes a comment for the team, all before deciding whether or not to open the laptop. For managers, it is the possibility of following the health of critical services from anywhere. Summit 2026 has a session dedicated to showing how the app brings monitoring closer to the people who need to act.
There are, however, points each organization must evaluate before allowing its use. The first is architecture: device registration and notifications go through infrastructure from Zabbix and the mobile platform providers, which may require analysis by the security and data protection areas, especially in public bodies and regulated sectors. The second is the access policy: which profiles will be allowed to act on problems from the phone. And the third is details that will only become fully clear at launch, such as compatibility with earlier Zabbix versions and commercial terms.
Why this matters now
In observability, the competition for attention is permanent. Teams deal with growing volumes of data, alerts, and tools, and the interface is the point where all of that meets a human being with limited time. Commercial platforms have invested heavily in user experience in recent years, and many teams that use Zabbix resort to external tools, such as Grafana, to fill visualization gaps.
Zabbix 8.0 responds to this on several fronts at once: an interface that adapts to each user’s profile, charts that answer questions faster, dashboards treated as code, operation actions closer to the real NOC flow, and an official presence on the phone. And the roadmap shows the movement continues in the next versions, with multilevel dashboards, dashboards that gather data from several Zabbix instances, and dynamic widgets based on prototypes, topics of the next and last article in this series.
The expert’s view
Of the interface novelties, the ones that caught my attention most were the customizable tables, both in the data views and in the environment configuration screens. Each user has their own way of working, and being able to adjust the screen to one’s own flow helps save clicks and minutes in operation. It seems small, but multiplied by dozens of analysts and hundreds of queries per day, it makes a real difference.
From the administrators’ point of view, the novelty I celebrated most was dashboard import and export. I have been through the experience of migrating hundreds of dashboards between environments and, for that, I had to develop scripts using the Zabbix API. This novelty solves that pain natively and also opens room for dashboard versioning, something the more mature teams will take great advantage of.
The mobile app tends to make life much easier for technical teams and managers, and expectations are high. But the question of architecture and access security is still a big challenge, especially for on-premises environments. There will be a lot of debate among monitoring, infrastructure, and security teams before the app is released in many organizations.
The ease of putting alerts into a maintenance period brings agility, but also the need for clear rules. The NOC team needs to be well aligned with the production technical team on when and how to use this feature. Convenience cannot mask a real problem.
Finally, the changes are considerable, and NOC and operations teams will need training on the new version, both to adapt quickly and to know how to take advantage of the improvements. Knowing the new interface and the new features is no longer optional for those who want to stay up to date. At the end of the day, it is always about greater productivity.
Conclusion
Zabbix 8.0 treats the interface as part of operations, not as finishing touches. Tables that adapt to the user, more informative charts, a visual correlation widget, exportable and versionable dashboards, maintenance actions closer to the problem, and an official mobile app form a set that reduces friction and response time. Not everything will be available on day one, and the app still needs to show in practice how it fits into each company’s policies. But the direction is clear: Zabbix wants to be used more easily, by more people, and in more places.
In the next and last article of the series, we will look beyond 8.0: what the roadmap shows for versions 8.2, 8.4, and 9.0, and where the product is heading.
Sources
- Zabbix Roadmap (official)
- What’s new in Zabbix 8.0 — official documentation (development version)
- Zabbix Mobile App — official page
- Zabbix Mobile Application Privacy Policy (Sep/2026)
- ZBXNEXT-4769 — Graph widget usability improvements
- ZBXNEXT-8339 — Ad-hoc maintenance / suppression of a trigger’s events
- ZBXNEXT-4774 — Maximize dashboard widgets
- ZBXNEXT-5419 — Dashboard import and export
- Zabbix Summit 2026 — agenda
About Target Solutions
Target Solutions has spent more than 15 years helping organizations evolve their infrastructure, monitoring, observability, automation, and operational intelligence operations. Across that journey, it has participated in projects in complex environments such as telecom, technology, government, energy, and large enterprises, helping increase operational efficiency and service reliability. As a Zabbix Certified Partner in Brazil, Target Solutions supports the deployment, evolution, sustainment, and optimization of enterprise Zabbix environments, integrating monitoring with ITSM, observability, and operational processes at scale.
About the author
Luciano Souza, Associate Consultant at Target Solutions.