

Target Solutions
EN

Solutions · Observability

Integrated Observability and Digital Operations

Monitoring, observability, event management, ITSM and operational automation can work as a single workflow. Target integrates IT and telecom tools and platforms so teams see services end to end, respecting investments already made.

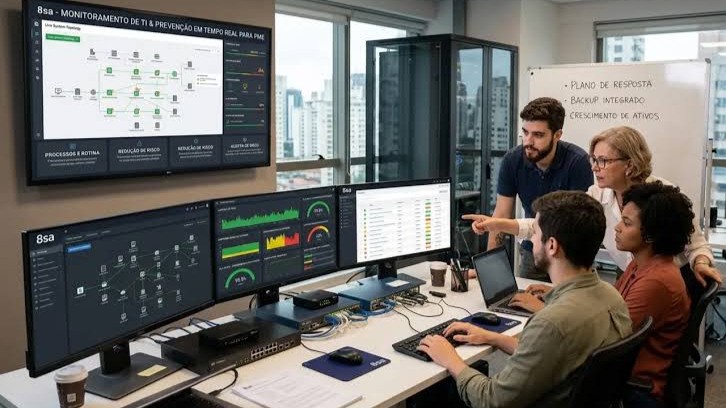
Operations team analyzing integrated monitoring and dashboards in an IT environment

From unified operational context to faster incident resolution

Target integrates monitoring, observability, event management and ITSM tools into a unified operational context, connecting information across environments and technologies.

With that integrated view, teams can correlate alerts intelligently, identify likely root causes faster and speed incident resolution—reducing operational effort and increasing IT team efficiency.

IT professional analyzing observability dashboards and operational metrics

Growing alert volume and operations under pressure

Hybrid environments increase monitoring alerts and events. Without correlation and ITSM integration, qualifying alerts, opening incidents and coordinating NOC, infrastructure and applications takes more effort. Operational response must unify what matters for the service—network, infrastructure, application and process—without replacing every tool at once.

Metrics, logs and traces Telemetry from multiple sources
Alert overload Noise before the ticket
Operational silos NOC, infra and applications
Service-centric view Network, infra, app and process

What we can integrate

Monitoring and observability (metrics, logs, traces) with Zabbix and portfolio platforms
Event and alert management and correlation
ITSM (incidents, changes, problems)
Operational automation and runbooks
IT and telecom platforms (SNMP, APIs, exporters)
Managed offerings and cloud monitoring

Three ways to integrate observability and operations

Qualified alert with contextual ticket creation

Illustrative example
Alert
Qualification
ITSM
Context in ticket
  • Challenge: Alerts open generic tickets without SLA or enough information for the analyst.
  • Integration: Events pass through dependency, maintenance and service-severity qualification before opening or updating a ticket. Host, service and recent history context travels with the ticket.

More focused first response and fewer duplicate tickets.

Observability in a hybrid environment

Illustrative example
Collectors
Observability
Unified dashboard
ITSM
  • Challenge: On-premises and public cloud metrics sit in separate consoles.
  • Integration: Datacenter and cloud telemetry feed business-service views with common alert policies. ITSM integration keeps the same incident flow regardless of signal origin.

Coherent view for shifts and capacity management.

Network operations with automated triage

Illustrative example
Network events
Enrichment
Triage
Escalation
  • Challenge: The NOC receives high volumes of network events before escalating to specialists.
  • Integration: Network events are enriched with topology and priority. Scripts or playbooks run initial checks; human escalation happens with evidence packages, not raw alarms alone.

Shifts focused on relevant exceptions, not repetitive noise.

Benefits of an integrated architecture

Less alert overload

Correlation and qualification before the ticket.

Context on first contact

Incidents arrive with data useful for diagnosis.

Service-oriented view

Metrics aligned to processes, not only components.

Gradual evolution

Step-by-step integration across existing tools.

Why integrate with Target

IT and telecom

Experience in real operations and multivendor environments.

Integrated ecosystem

Professional services, partners and complementary offerings in one design.

Multistack, not single-tool

The solution is not reduced to one product. Zabbix deployment stays under Services.

Need to integrate monitoring, events and operations?

Share tools in use, alert volume and operational goals. Target supports integrated design and points to suitable services or offerings.

Talk to Target